🚀 AWS QuickSight: The Ultimate Tool Every Data Scientist Must Master! 📊🧠
🚀 AWS QuickSight: The Ultimate Tool Every Data Scientist Must Master! 📊🧠
In a world dominated by data-driven decisions, businesses can’t afford to stay behind when it comes to analytics. That’s where AWS QuickSight steps in — a powerful, scalable, and AI-powered business intelligence (BI) tool from Amazon Web Services.
Whether you’re a Data Scientist, Analyst, or a Business Leader, QuickSight helps you analyze, visualize, and share insights from your data within seconds — all in the cloud.
Let’s break it all down and explore why QuickSight is a game-changer for data science and business growth. 🔍💡
🔍 What is AWS QuickSight?
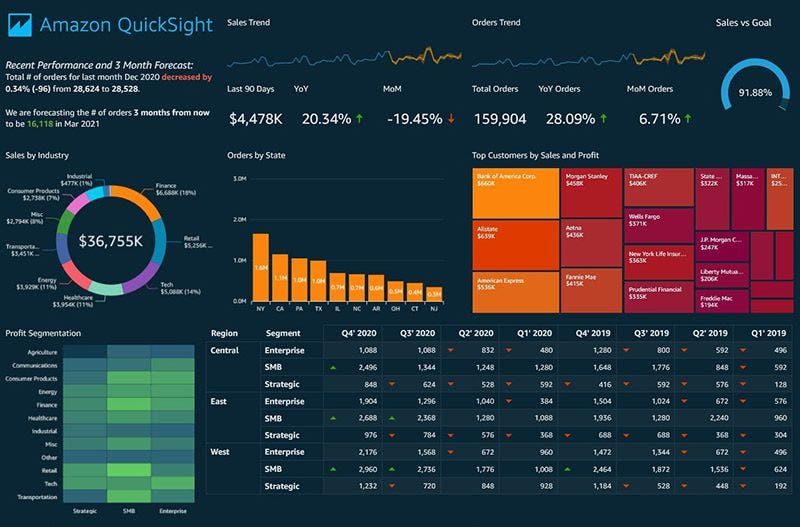
AWS QuickSight is a serverless business intelligence tool that allows you to build interactive dashboards, perform analytics, and visualize data using simple drag-and-drop or SQL queries.
It connects to multiple data sources, uses machine learning for insights, and is pay-per-session, making it both powerful and cost-effective.
💡 Key Features of AWS QuickSight — Explained with Examples
1. 📊 Interactive Dashboards
Feature: Create beautiful, real-time dashboards using drag-and-drop visualizations.
Example: A sales team can create a dashboard that shows live sales performance across different regions using bar charts, maps, and KPIs.
✅ Supports filters, parameters, and drill-downs for deeper analysis.
2. 🔌 Seamless Data Connectivity
Feature: Connect to various data sources like:
- Amazon S3
- RDS (MySQL, PostgreSQL)
- Redshift
- Athena
- Salesforce
- Excel/CSV files
- On-premises databases
Example: Connect to a live Redshift data warehouse and visualize stock levels in real-time for inventory management.
3. 🧠 ML-Powered Insights (Auto-Narratives)
Feature: Automatically generate AI/ML-driven insights using Natural Language Narratives.
Example: QuickSight can tell you, “Sales in Region A grew by 12% in Q1 compared to Q4,” without writing a single line of code.
🤯 Perfect for non-technical stakeholders to understand trends.
4. 📈 Advanced Visualizations
Feature: Choose from a variety of visual types:
- Heat Maps
- Pivot Tables
- Donut Charts
- Line & Area Charts
- Scatter Plots
- Combo Charts
- Geospatial Maps 🌍
Example: Use Geo Maps to plot user signups across the country by region.
5. 🧩 Embedded Analytics
Feature: Embed dashboards into your apps, portals, or intranet using the QuickSight Embedded SDK.
Example: E-commerce platforms can embed analytics dashboards for vendors to track their product performance.
💡 Custom-branded analytics with full security control.
6. 🔐 Fine-Grained Access Control
Feature: Use row-level security (RLS) and IAM roles to manage who sees what.
Example: Regional Managers only see their region’s performance data — all from a single dashboard.
7. 💵 Pay-per-Session Pricing
Feature: You only pay when users interact with dashboards. Ideal for scalable use.
Example: If a user views the dashboard once a month, you’re charged for just one session — not a flat license!
💰 Massive cost savings for large organizations.
8. 📤 Scheduled Email Reports
Feature: Schedule dashboard snapshots to be emailed as PDFs or images.
Example: Automatically send a weekly executive report every Monday at 8 AM to stakeholders.
9. 🧮 SPICE Engine (Super-fast)
Feature: QuickSight uses the SPICE (Super-fast, Parallel, In-memory Calculation Engine) to load and process massive data super quickly.
Example: A dataset with millions of records loads in seconds, not minutes.
10. 🧪 Custom Calculations & Parameters
Feature: Use calculated fields and parameters for dynamic data exploration.
Example: Create a parameter for “Select Year” and change the entire dashboard’s metrics with just one click.
🏢 Real Business Benefits — Why It Matters!
✅ 1. Faster Decision Making
Visual insights and AI-powered narratives help teams spot trends and outliers quickly.
✅ 2. Democratized Data
Even non-technical users can explore data without relying on engineers or data scientists.
✅ 3. Reduced Operational Cost
No need to manage infrastructure. Fully serverless, cost-effective, and scalable.
✅ 4. Embedded Analytics = Competitive Edge
Deliver data insights within your product — drive user engagement and increase value.
✅ 5. Security and Compliance
Built-in AWS IAM integration ensures secure, compliant data access.
🎯 Use Cases for Data Scientists

🛠️ How to Get Started?
- Sign in to your AWS Console
- Go to QuickSight
- Choose a data source or upload your dataset
- Build visualizations using the intuitive UI
- Share dashboards or embed them 🔗
🌟 Final Thoughts
AWS QuickSight isn’t just another BI tool. It’s the smart, scalable, and future-ready platform that transforms data into actions. Whether you’re a startup, enterprise, or solo data scientist — this is your analytics superpower. 💪📊
“Without data, you’re just another person with an opinion.” — W. Edwards Deming
So, if you want data to speak loud and clear, let AWS QuickSight be your voice! 🔥


Comments
Post a Comment