🚀 AWS QuickSight Mastery: Build Powerful Business Intelligence Dashboards Without Managing Servers 📊☁️
🚀 AWS QuickSight Mastery: Build Powerful Business Intelligence Dashboards Without Managing Servers 📊☁️
In today’s data-driven world, companies generate millions of records every day — customer behavior, sales transactions, application logs, marketing performance, operational metrics, and more. But raw data alone is useless unless we can transform it into meaningful insights.
This is where Amazon QuickSight comes in. 🌟
Amazon QuickSight is a cloud-powered Business Intelligence (BI) and analytics service by Amazon Web Services that allows you to create interactive dashboards, perform advanced analytics, embed visualizations into applications, and make data-driven decisions — without managing infrastructure.
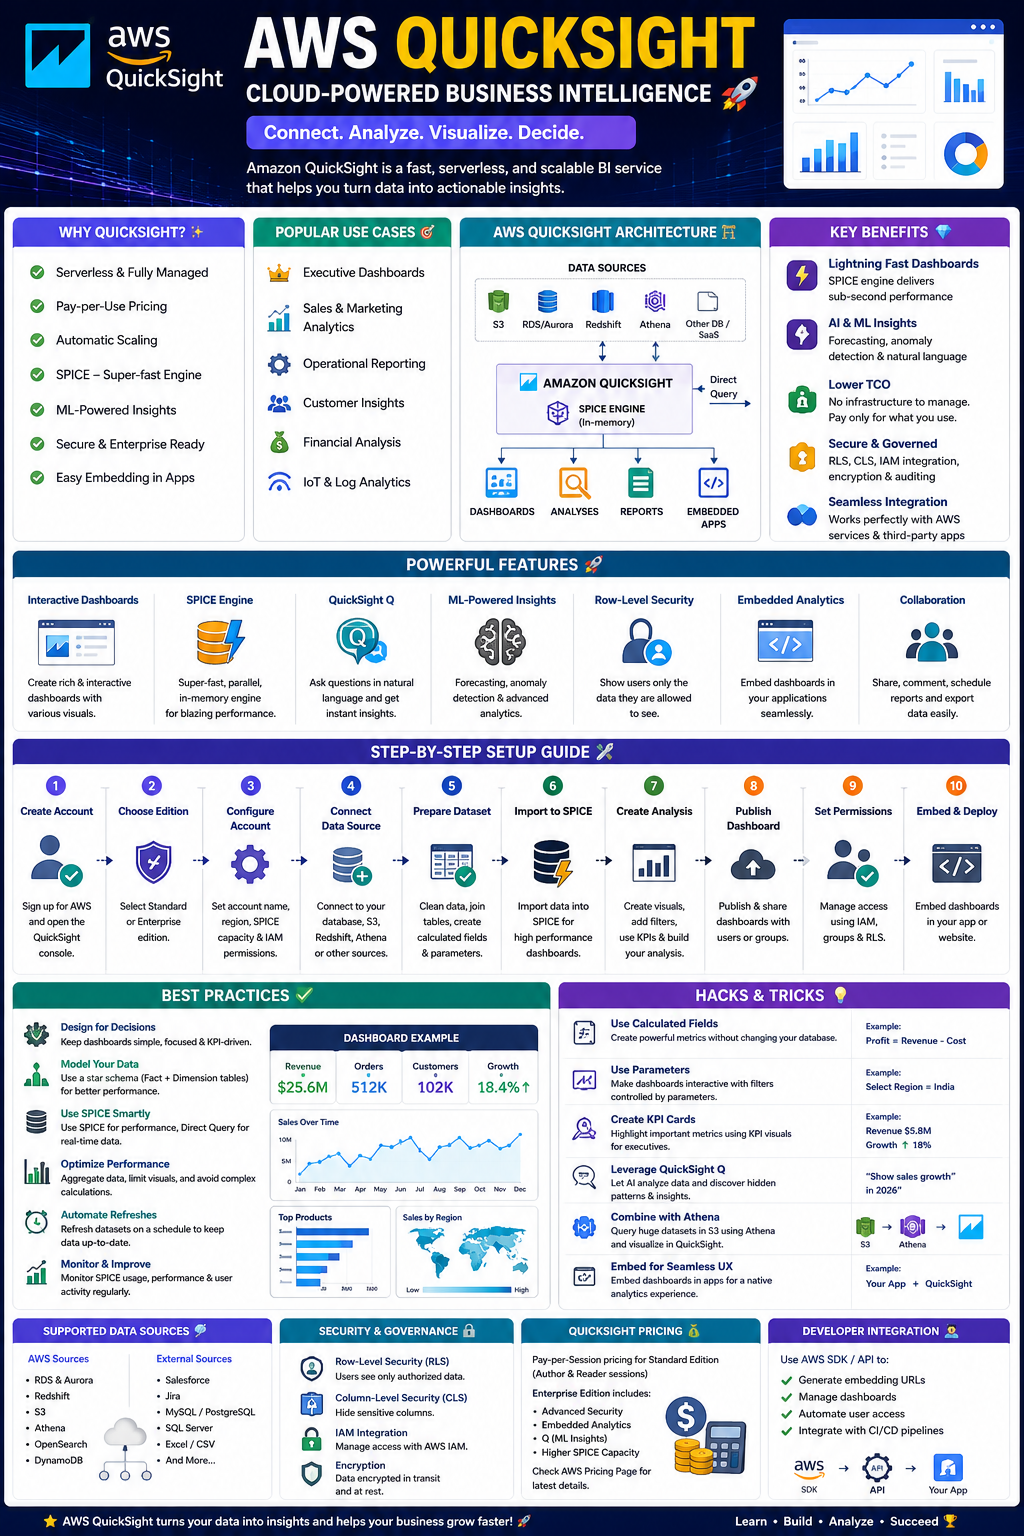
Whether you are a developer, data analyst, startup founder, or enterprise architect, QuickSight helps you turn data into actionable intelligence. 📈
🌟 What is AWS QuickSight?
Amazon QuickSight is a serverless BI platform that connects to multiple data sources, analyzes information, and creates interactive dashboards.
Think of QuickSight as:
Your Data Sources
        |
        ↓
Data Processing & Analysis
        |
        ↓
Interactive Dashboards
        |
        ↓
Business Decisions
Example:
An e-commerce company wants to analyze:
- 🛒 Daily sales
- 👥 Customer retention
- 📦 Inventory levels
- 💰 Revenue trends
- 🌍 Regional performance
Instead of manually creating Excel reports, QuickSight automatically generates live dashboards.
🔥 Why Choose AWS QuickSight?
Traditional BI tools require:
❌ Dedicated servers
❌ Database administration
❌ Expensive licenses
❌ Complex deployment
QuickSight provides:
✅ Serverless architecture
✅ Pay-per-use pricing
✅ Automatic scaling
✅ AI-powered analytics
✅ Cloud-native integration
✅ Real-time dashboards
🏗️ AWS QuickSight Architecture
A typical QuickSight architecture looks like:
            Data Sources
                   |
    --------------------------------
    |              |               |
  RDS            S3             Redshift
    |              |               |
    --------------------------------
                   |
            AWS QuickSight
                   |
        ---------------------
        |                   |
    SPICE Engine       Direct Query
        |
 Interactive Dashboards
        |
 Users / Applications
🧩 Core Components of AWS QuickSight
1. Data Sources 🔌
QuickSight can connect with many sources:
AWS Services
- Amazon RDS
- Amazon Aurora
- Amazon Redshift
- Amazon Athena
- Amazon S3
- Amazon OpenSearch
External Sources
- Salesforce
- Jira
- Excel
- CSV
- SQL databases
Example:
Your Rails application stores data in PostgreSQL:
Rails App
    |
PostgreSQL Database
    |
AWS QuickSight Dashboard
2. SPICE Engine ⚡
SPICE stands for:
Super-fast, Parallel, In-memory Calculation Engine
It is QuickSight’s secret weapon.
Instead of repeatedly querying databases:
User Request
      |
      ↓
Database Query
      |
      ↓
Result
SPICE stores optimized data:
Database
   |
   ↓
SPICE Memory
   |
   ↓
Instant Dashboard
Benefits:
✅ Faster dashboards
✅ Lower database load
✅ Millions of rows analysis
✅ Better user experience
3. Interactive Dashboards 📊
QuickSight allows you to create:
Charts
- Bar charts
- Line charts
- Pie charts
- Scatter plots
- Heat maps
Business Metrics
Example:
Revenue
$2.5 Million

Customers
125,000

Growth
+18%
4. Data Visualization Features 🎨
QuickSight supports:
Filters
Example:
Show only:
Country = India
Year = 2026
Product = Laptop
Drill Down
Example:
Sales:
India
 |
 ├── Madhya Pradesh
 |
 ├── Maharashtra
 |
 └── Gujarat
Users can explore deeper.
Conditional Formatting
Example:
Sales dashboard:
Green  → Profit
Red    → Loss
Yellow → Warning
5. Amazon QuickSight Q 🤖
QuickSight Q uses Natural Language Processing.
Instead of creating charts manually:
Ask:
“Show me sales growth in 2026”
QuickSight automatically creates:
- Charts
- Insights
- Trends
Example:
Business user:
“Which product generated maximum revenue?”
AI:
Product A
Revenue: $5M
Growth: 32%
6. ML-Powered Insights 🧠
QuickSight includes machine learning capabilities:
Forecasting
Example:
Historical sales:
Jan 1000
Feb 1200
Mar 1500
Prediction:
April Expected:
1900
Anomaly Detection
Find unusual patterns.
Example:
Normal:
Daily Sales:
$50k
$55k
$52k
Detected:
Yesterday:
$5k ⚠️
7. Embedded Analytics 🖥️
You can embed QuickSight dashboards inside applications.
Example:
Your SaaS product:
Customer Login
      ↓
Analytics Dashboard
      ↓
QuickSight Embedded
Common use cases:
- SaaS platforms
- Customer portals
- Admin dashboards
8. Security Features 🔐
QuickSight provides:
Row-Level Security (RLS)
Example:
Company hierarchy:
Manager A
   |
   Only sees Team A data

Manager B
   |
   Only sees Team B data
Column-Level Security
Hide sensitive fields:
Employee Name
Salary
Bank Account
9. Collaboration Features 🤝
Teams can:
- Share dashboards
- Add comments
- Schedule reports
- Export data
🚀 AWS QuickSight Setup Guide (Step-by-Step)
Step 1: Create AWS Account
Visit:
Create an AWS account.
Step 2: Open QuickSight Console
AWS Console:
Services
   ↓
Analytics
   ↓
QuickSight
Click:
Sign up for QuickSightStep 3: Choose Edition
Available options:
Standard Edition
For:
- Small teams
- Basic dashboards
Enterprise Edition
For:
- Organizations
- Advanced security
- ML insights
Step 4: Configure Account
Choose:
Region
|
Account Name
|
SPICE Capacity
|
IAM Permissions
Step 5: Connect Data Source
Example PostgreSQL:
New Dataset
      ↓
Database
      ↓
PostgreSQL
      ↓
Credentials
      ↓
Connect
Step 6: Prepare Dataset
Clean your data:
Example:
Before:
Date — 2026–01–01
Amount — 100
After:
Month — Jan
Revenue — 100
Create calculated fields:
Example:
Profit:
Revenue - CostStep 7: Import Data into SPICE
Choose:
Import into SPICEAdvantages:
⚡ Faster performance
💰 Lower database cost
Step 8: Create Analysis
Click:
New AnalysisAdd:
- Visuals
- Filters
- Calculations
Example dashboard:
--------------------------------
Revenue Overview
$10M
--------------------------------
Sales Trend Graph
--------------------------------
Top Products
--------------------------------
Customer Map
--------------------------------
Step 9: Publish Dashboard
Click:
Share
↓
Publish Dashboard
Set:
- Users
- Groups
- Permissions
Step 10: Deploy Embedded Dashboard
For applications:
Architecture:
Frontend
 React / Angular
       |
Backend
 Rails / Node
       |
AWS SDK
       |
QuickSight Dashboard
Example:
Generate embedding URL:
Backend API
↓
QuickSight API
↓
Embedded Dashboard URL
↓
Frontend Display
🔥 AWS QuickSight Best Practices
1. Design Dashboards for Decisions 🎯
Bad:
100 charts
100 filters
Good:
5 important KPIs
+
3 meaningful charts
2. Optimize Data Models
Avoid:
Huge Raw TablesPrefer:
Fact Tables
+
Dimension Tables
Example:
Sales Warehouse:
Fact_Sales
Dimension_Product
Dimension_Customer
Dimension_Date
3. Use SPICE Smartly ⚡
Use SPICE when:
✅ Data changes periodically
✅ Fast dashboards needed
Use Direct Query when:
✅ Real-time data required
4. Create Reusable Templates
Example:
Company dashboard:
Executive Dashboard
Sales Dashboard
Marketing Dashboard
Finance Dashboard
5. Automate Refreshes 🔄
Configure:
Dataset
↓
Schedule Refresh
↓
Hourly/Daily/Weekly
Example:
Sales dashboard:
Every midnight

Refresh latest transactions
🧠 AWS QuickSight Hacks & Tricks
Hack 1: Use Calculated Fields
Instead of modifying databases:
Create calculations inside QuickSight.
Example:
Customer Growth:
(Current Customers -
Previous Customers)
/ Previous Customers
Result:
+25%Hack 2: Create KPI Cards
Executives love KPIs.
Example:
💰 Revenue
$5.8M

👥 Customers
250K

📈 Growth
18%
Hack 3: Use Parameters
Create interactive dashboards.
Example:
Parameter:
Select Region
[India ▼]
Dashboard changes automatically.
Hack 4: Optimize Performance
Avoid:
❌ Too many visuals
❌ Complex calculations
❌ Huge datasets
Prefer:
✅ SPICE
✅ Aggregated tables
✅ Optimized queries
Hack 5: Combine With AWS Athena
For huge datasets:
S3 Data Lake
      |
Athena Query
      |
QuickSight Dashboard
Perfect for:
- Logs
- IoT data
- Analytics platforms
Hack 6: Integrate With Applications
Example:
Your Ruby on Rails SaaS:
User Login
↓
Rails Controller
↓
QuickSight Embed API
↓
Dashboard
Use cases:
- Customer analytics
- Admin panels
- Reports
Real-World Example: E-Commerce Analytics Dashboard 🛒
Data:
Orders Table
Customers Table
Products Table
Dashboard:
Overview
Total Revenue
$25M

Orders
500K

Customers
100K
Sales Analysis
Charts:
- Monthly revenue
- Best products
- Customer segments
AI Insights
Prediction:
Next month revenue:
+$18%
Common Mistakes To Avoid ⚠️
❌ Too Many Visuals
Problem:
Dashboard becomes confusing.
Solution:
Follow:
Less Data
+
More Insights
❌ Poor Data Preparation
Garbage data:
↓
Garbage dashboard
Always clean data first.
❌ Ignoring Security
Never expose:
- Personal information
- Financial data
- Internal metrics
Use:
- IAM
- RLS
- Permissions
❌ No Performance Monitoring
Monitor:
- Query speed
- SPICE usage
- Dataset size
AWS QuickSight Developer Checklist ✅
Before Production:
☑ Data source optimized
☑ Dataset cleaned
☑ SPICE configured
☑ Security enabled
☑ Dashboard tested
☑ Mobile view checked
☑ User permissions verified
☑ Refresh schedule configured
☑ Performance optimized
☑ Backup strategy created
🚀 Final Thoughts
AWS QuickSight is more than a dashboard tool — it is a complete cloud-native intelligence platform.
The combination of:
🔥 Serverless architecture
🔥 AI-powered analytics
🔥 Machine learning insights
🔥 Embedded dashboards
🔥 AWS ecosystem integration
makes it a powerful choice for modern applications.
The future belongs to companies that can transform data into decisions quickly. AWS QuickSight helps developers and businesses build that future. 🌎📊
Learn data. Visualize insights. Build smarter systems. 🚀


Comments
Post a Comment