🐞 Debugging: The Art of Mastering — Think Like Sherlock Holmes, Fix Like a Senior Engineer 🚀
🐞 Debugging: The Art of Mastering — Think Like Sherlock Holmes, Fix Like a Senior Engineer 🚀
“The best debugger is not the IDE. It’s the developer who knows where to look.”
Every developer writes bugs.
The difference between a junior and a senior developer isn’t the number of bugs they create — it’s how quickly they find, understand, and eliminate them.
Great debugging is not luck.
It is a systematic investigation.
Whether you’re working with Ruby on Rails, Python, JavaScript, Java, Go, C++, or any other language, the principles remain exactly the same.
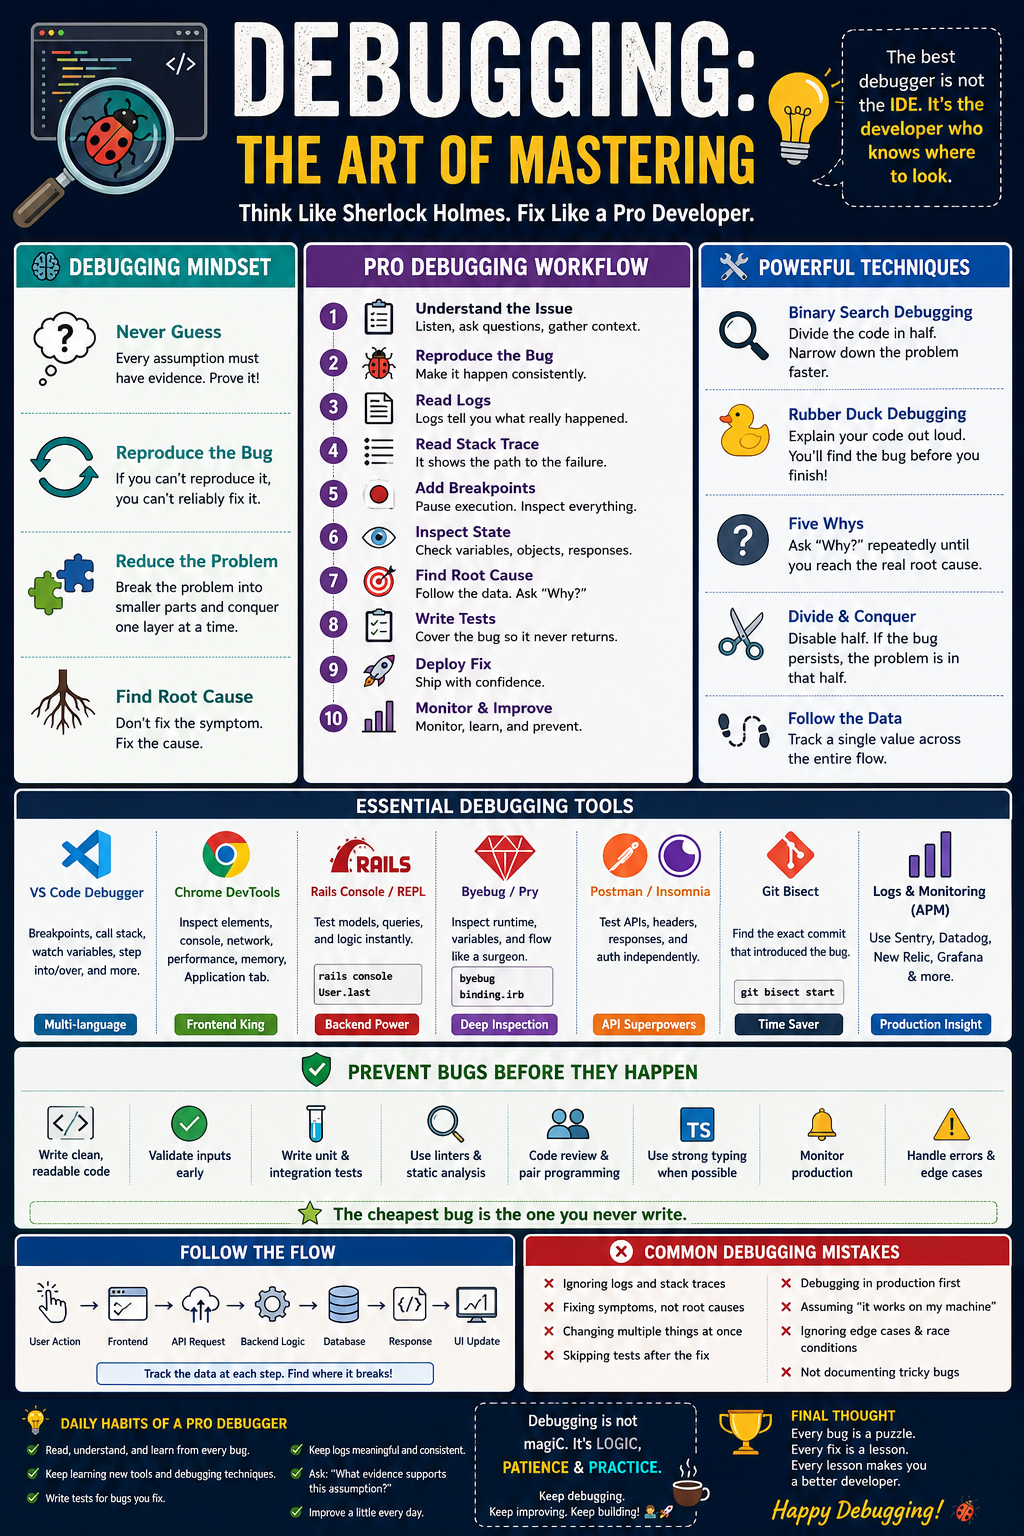
Let’s master them.
🎯 What is Debugging?
Debugging is the structured process of:
- Finding the problem
- Understanding why it happened
- Fixing the root cause
- Ensuring it never returns
Many developers stop after fixing the symptom.
Professional developers fix the disease.
Example:
Instead of changing
price = nilto
price ||= 0they ask
“Why was price nil in the first place?”
That question separates professionals from beginners.
🧠 Principle 1: Never Guess
The biggest debugging mistake is assuming.
Bad debugging:
“Maybe cache issue.”
“Maybe database issue.”
“Maybe browser issue.”
Professional debugging says:
“Let’s prove it.”
Every assumption must have evidence.
🔍 Principle 2: Reproduce the Bug
If you cannot reproduce it,
you cannot reliably fix it.
Imagine a user reports:
Payment failed.
Questions to ask:
- Which browser?
- Which device?
- Which account?
- Which product?
- Which environment?
- Network speed?
- Exact steps?
Eventually you’ll get
1. Login
2. Add product
3. Apply coupon
4. Refresh page
5. Click Pay
Boom 💥
Bug reproduced.
Now you’re in control.
🧩 Principle 3: Reduce the Problem
Large applications are overwhelming.
Break everything into smaller pieces.
Instead of
ApplicationThink
↓
Frontend
↓
API
↓
Authentication
↓
Controller
↓
Service
↓
Database
Now eliminate one layer at a time.
🕵️ Principle 4: Binary Search Debugging
One of the fastest debugging techniques.
Imagine a function with 200 lines.
Instead of reading everything,
add logs in the middle.
Reached Here?If yes,
the bug is below.
If no,
it’s above.
Now split again.
200 → 100 → 50 → 25 → 12 → 6
Within minutes you’ve isolated the bug.
🧪 Principle 5: Read the Error Carefully
Most developers read only
Undefined MethodProfessionals read the entire stack trace.
Example
NoMethodError
undefined method `name'
UserController#create
line 42
The stack trace tells you
- file
- method
- line
- execution path
Never ignore it.
📋 Principle 6: Read the Logs
Logs are your best detective.
Example Rails log
Started POST "/users"
Parameters:
name: nil
email: "abc@test.com"
Immediately you know
The frontend never sent the name.
No need to inspect the database.
🛠 Principle 7: Use Breakpoints
Logging is useful.
Breakpoints are better.
Examples:
Ruby
binding.irbor
byebugPython
breakpoint()JavaScript
debugger;Now inspect
- variables
- objects
- API response
- execution flow
without changing code.
🔬 Principle 8: Inspect State
Don’t trust what you think.
Print actual values.
Bad
if(user)Good
console.log(user)Maybe
{}Maybe
nullMaybe
undefinedEntirely different problems.
⚡ Principle 9: Follow the Data
Every bug starts with data.
Example
Frontend
↓
API
↓
Controller
↓
Service
↓
Database
↓
Response
↓
UI
Track one value.
Example
User NameWhere did it disappear?
That is the bug.
🧱 Principle 10: Verify Every Layer
Don’t blame the backend.
Don’t blame the frontend.
Check everything.
Example
Button clicked?
↓
API called?
↓
Authentication passed?
↓
SQL executed?
↓
Data returned?
↓
Rendered?
Eventually one answer becomes
❌ No
That’s where your investigation begins.
🛠 Professional Debugging Workflow
Step 1
Understand the issue.
Never start coding.
Step 2
Reproduce consistently.
Step 3
Read logs.
Step 4
Read stack trace.
Step 5
Add breakpoints.
Step 6
Inspect variables.
Step 7
Find root cause.
Step 8
Write tests.
Step 9
Deploy.
Step 10
Monitor.
💻 Essential Debugging Tools
VS Code Debugger
Perfect for
- JavaScript
- Node
- Python
- Go
- PHP
- C#
Features
✅ Breakpoints
✅ Watch Variables
✅ Call Stack
✅ Memory
Chrome DevTools 🌐
Amazing for frontend.
Use it to inspect
- DOM
- CSS
- JavaScript
- Network
- Performance
- Memory leaks
- Local Storage
The Network tab alone solves hundreds of API issues.
Rails Console
rails consoleTest models instantly.
User.lastNo need to refresh browser.
Pry / Byebug
binding.irbInspect runtime like a surgeon.
Postman / Insomnia
Test APIs independently.
If Postman works but frontend fails,
problem is frontend.
Database Clients
Examples
- pgAdmin
- TablePlus
- DBeaver
- MySQL Workbench
Directly inspect
- rows
- indexes
- constraints
Git Bisect 🔥
One of the most underrated tools.
If bug appeared after 200 commits
Git automatically finds the exact commit.
git bisect startIncredible productivity booster.
Docker Logs
docker logs container_nameEssential for containerized applications.
Kubernetes Logs
kubectl logs pod-nameProduction debugging begins here.
Application Performance Monitoring (APM)
Professional teams rely on tools such as:
- Sentry (error tracking)
- Datadog (observability)
- New Relic (performance)
- Grafana (metrics & dashboards)
- OpenTelemetry (distributed tracing)
These tools help you pinpoint production issues faster by correlating logs, traces, and metrics.
🧠 Debugging Mental Models
Rubber Duck Debugging 🦆
Explain the code aloud.
Many developers discover the bug before finishing the explanation.
Five Whys
Example
API failed.
Why?
Database timeout.
Why?
Query slow.
Why?
Missing index.
Why?
Migration forgotten.
Root cause found.
Divide and Conquer
Disable half.
Still broken?
Continue.
Extremely effective.
🚀 Debug Like a Senior Developer
Instead of
Print everything.Print strategically.
Instead of
Read all files.Read execution flow.
Instead of
Fix symptom.Fix architecture.
🛡️ Prevent Bugs Before They Happen
The cheapest bug is the one you never write. These habits dramatically reduce defects:
✅ Write Small Functions
Keep each function focused on one responsibility.
✅ Use Meaningful Names
Avoid:
x = 5Prefer:
retry_limit = 5✅ Validate Inputs Early
raise ArgumentError, "Email required" if email.blank?✅ Write Unit Tests
Test business logic in isolation.
✅ Add Integration Tests
Ensure components work together.
✅ Add End-to-End Tests
Simulate real user journeys.
✅ Enable Static Analysis
Use tools such as RuboCop, ESLint, Pylint, TypeScript, SonarQube, and language-specific linters to catch issues before runtime.
✅ Use Strong Typing When Possible
Type systems catch many errors before execution.
✅ Review Code
A fresh pair of eyes often spots hidden issues.
✅ Use Feature Flags
Roll out risky changes gradually instead of exposing them to all users.
✅ Monitor Production
Create alerts for rising error rates, latency, and failed background jobs.
✅ Write Defensive Code
Assume external systems can fail and handle errors gracefully.
⚡ High-Performance Debugging Techniques
🔥 Log with Context
Instead of:
Error occurredPrefer:
Order #2451 failed for user 982 during payment processingContext makes logs actionable.
📈 Correlation IDs
Attach a unique request ID to every log entry so a single user request can be traced across multiple services.
🧵 Structured Logging
Log structured fields (JSON) rather than long free-form messages to make searching and filtering easier.
🧪 Reproduce with Production Data
When safe and anonymized, reproduce bugs using realistic datasets instead of tiny sample data.
🕒 Time Travel Debugging
Where supported, record execution so you can inspect the exact state leading to a failure instead of relying only on logs.
📊 Monitor Before Users Report
Dashboards and automated alerts should notify your team before customers notice an issue.
🚫 Common Debugging Mistakes
❌ Ignoring warning messages
❌ Fixing without understanding
❌ Skipping tests after the fix
❌ Changing multiple things at once
❌ Debugging in production first
❌ Assuming “it works on my machine”
❌ Ignoring edge cases and race conditions
❌ Not documenting tricky bugs for future reference
💡 Daily Habits That Make You a Better Debugger
- Read stack traces completely.
- Learn your IDE’s debugger shortcuts.
- Write automated tests for every bug you fix.
- Keep logs meaningful and consistent.
- Study incident postmortems from experienced engineering teams.
- Review production metrics regularly.
- Build a habit of asking, “What evidence supports this assumption?”
🎯 Final Thoughts
Debugging is not about magic — it is about observation, evidence, and discipline.
The world’s best developers are not those who never write bugs.
They are the ones who can calmly investigate, isolate, fix, and prevent them with a repeatable process.
Every difficult bug you solve sharpens your intuition, improves your architecture, and makes you a stronger engineer.
So the next time an error appears on your screen, don’t panic.
Smile 😊
Because every bug is simply another puzzle waiting to be solved.
“Master debugging, and you’ll master software development.” 🚀


Comments
Post a Comment