📊 Mastering Data Analysis: The Complete Guide to Turning Raw Data into Powerful Insights 🚀
📊 Mastering Data Analysis: The Complete Guide to Turning Raw Data into Powerful Insights 🚀
“Without data, you’re just another person with an opinion.” — W. Edwards Deming
Every successful company today — from startups to Fortune 500 giants — relies on Data Analysis to make informed decisions.
Whether it’s Netflix recommending your next favorite show 🎬, Amazon predicting what you’ll buy next 🛒, or hospitals improving patient care 🏥, data analysis is the hidden engine driving intelligent decisions.
In this guide, you’ll learn:
- 📈 What Data Analysis is
- 🧠 Core Principles
- 🔄 Types of Data Analysis
- 🛠 Essential Tools
- 📊 Data Analysis Process
- ⚡ Optimization Tips
- 🚀 Best Practices
- ❌ Common Mistakes
- 💡 Real-world Examples
- ✅ Complete Checklist
Let’s dive in!
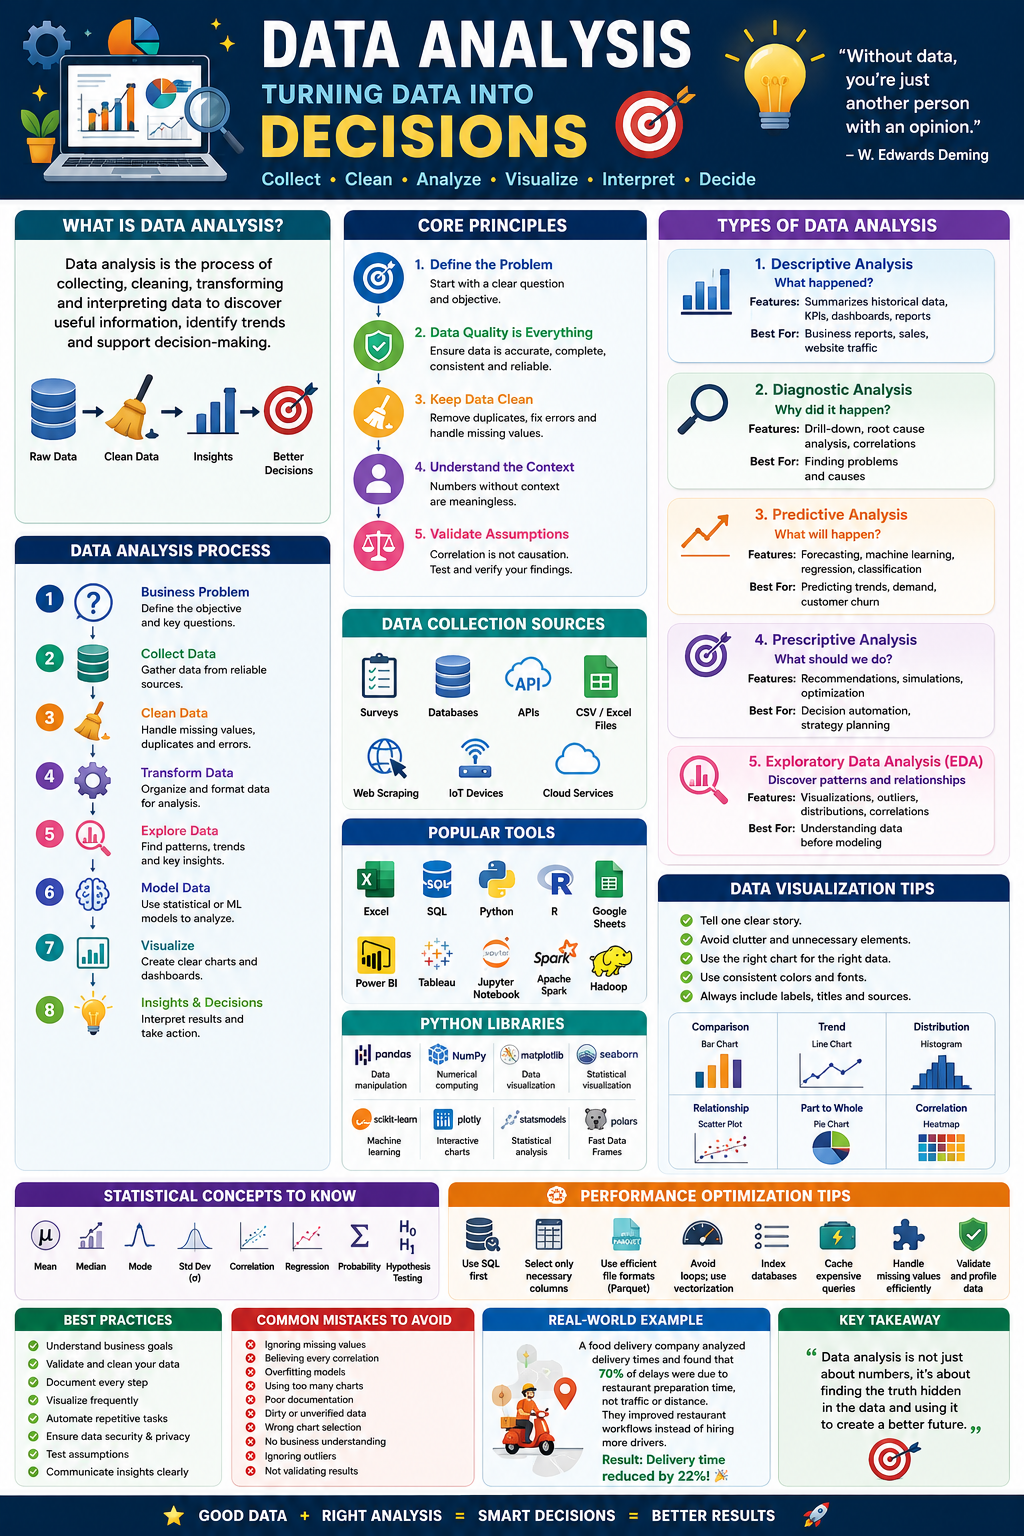
📌 What is Data Analysis?
Data Analysis is the process of collecting, cleaning, transforming, and interpreting data to discover useful information, identify trends, and support decision-making.
Think of it as solving a mystery.
Raw Data
     ↓
Cleaning
     ↓
Transformation
     ↓
Analysis
     ↓
Visualization
     ↓
Insights
     ↓
Business Decision
🎯 Why Data Analysis Matters
Organizations use it to:
✅ Increase revenue
✅ Reduce costs
✅ Improve customer satisfaction
✅ Predict future trends
✅ Detect fraud
✅ Optimize operations
Example:
An e-commerce company notices customers abandon carts after shipping costs are shown.
➡️ Analysis reveals shipping fees are too high.
➡️ Company introduces free shipping above ₹999.
➡️ Sales increase by 28%.
That’s the power of data.
🧠 Core Principles of Data Analysis
1️⃣ Define the Problem First
Never analyze data without a question.
Instead of
“Analyze sales.”
Ask
“Why have sales dropped in the last 3 months?”
A clear objective saves hours.
2️⃣ Data Quality is Everything
Garbage In = Garbage Out
Ensure data is:
✅ Accurate
✅ Complete
✅ Consistent
✅ Reliable
✅ Timely
3️⃣ Keep Data Clean
Remove
❌ Duplicates
❌ Missing values
❌ Invalid entries
❌ Wrong formats
Example
Age
25
25
NULL
-5
Needs cleaning before analysis.
4️⃣ Understand the Context
Numbers without context are meaningless.
Example:
Sales increased 40%.
Great?
Maybe not.
If marketing spending increased 200%, profits actually declined.
5️⃣ Validate Assumptions
Never assume
Correlation ≠ Causation
Example
Ice cream sales increase.
Drowning incidents increase.
Ice cream doesn’t cause drowning.
Summer causes both.
📊 Types of Data Analysis
1️⃣ Descriptive Analysis 📈
Answers:
What happened?
Example:
Monthly Sales Report
Features
✅ Historical data
✅ Dashboards
✅ KPI Reporting
Best For
- Business reports
- Sales
- Website traffic
2️⃣ Diagnostic Analysis 🔍
Answers:
Why did it happen?
Uses
- Root Cause Analysis
- Drill-down Reports
Example
Sales dropped because
- Stock unavailable
- Ads stopped
- Website slower
Best Use
Finding business problems
3️⃣ Predictive Analysis 🔮
Answers
What will happen?
Uses
Machine Learning
Regression
Forecasting
Example
Predict
Future sales
Stock demand
Weather
Customer churn
Best Use
Forecasting
4️⃣ Prescriptive Analysis 🎯
Answers
What should we do?
Suggests actions.
Example
Recommend
Increase inventory
Reduce price
Target premium customers
Best Use
Decision automation
5️⃣ Exploratory Data Analysis (EDA) 🧩
Used before modeling.
Finds
Patterns
Outliers
Relationships
Visualizations
Scatter Plot
Histogram
Box Plot
Heatmap
📋 Complete Data Analysis Workflow
Business Problem
        ↓
Collect Data
        ↓
Clean Data
        ↓
Transform Data
        ↓
Explore Data
        ↓
Model Data
        ↓
Visualize
        ↓
Insights
        ↓
Business Decision
📂 Data Collection Methods
Surveys
✔ Customer feedback
APIs
Weather
Finance
Maps
Databases
MySQL
PostgreSQL
MongoDB
CSV Files
Excel exports
IoT Devices
Sensors
Smart homes
Machines
🛠 Essential Data Analysis Tools
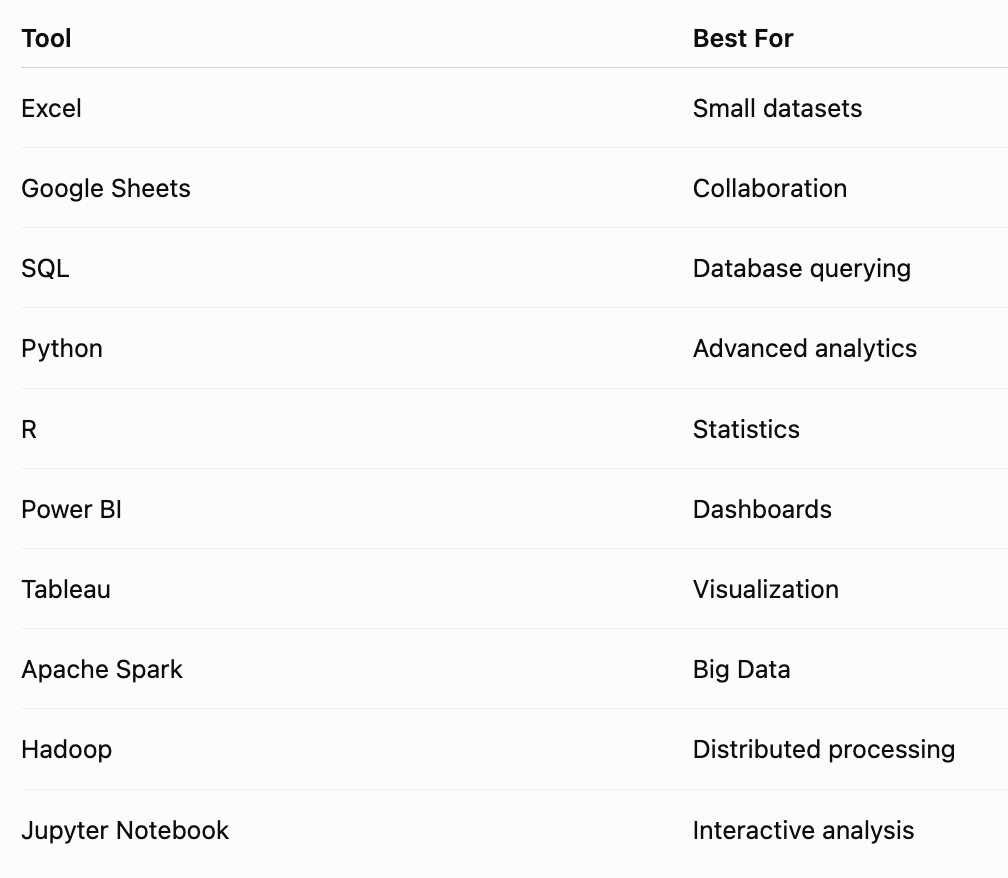
🐍 Popular Python Libraries
Pandas
✔ Data manipulation
NumPy
✔ Fast mathematical operations
Matplotlib
✔ Charts
Plotly
✔ Interactive dashboards
Scikit-learn
✔ Machine Learning
Seaborn
✔ Statistical visualization
Statsmodels
✔ Statistical analysis
Polars
✔ Ultra-fast dataframe library
DuckDB
✔ SQL for analytics
📈 Data Visualization Principles
A good chart should
✅ Tell one story
✅ Avoid clutter
✅ Use readable colors
✅ Include labels
✅ Highlight insights
Wrong
20 different colorsCorrect
Simple Bar Chart
Sales
Jan ██████
Feb █████████
Mar ███████████
📊 Statistical Concepts You Should Know
Mean
Median
Mode
Variance
Standard Deviation
Correlation
Regression
Probability
Confidence Interval
Hypothesis Testing
🤖 Machine Learning in Data Analysis
Common algorithms
Regression
Decision Trees
Random Forest
XGBoost
K-Means
Naive Bayes
Neural Networks
Use Cases
Fraud Detection
Recommendations
Sales Prediction
Customer Segmentation
⚡ Performance Optimization Tips
Use SQL Before Python
Instead of loading millions of rows
Filter first
SELECT *
FROM orders
WHERE created_at >= CURRENT_DATE - INTERVAL '30 days';
Avoid Unnecessary Columns
Bad
SELECT *Good
SELECT
customer_id,
price
Use Vectorized Operations
Avoid loops.
Pandas performs much faster using vectorized methods.
Cache Expensive Queries
Avoid repeatedly calculating identical results.
Use Efficient File Formats
CSV ❌
Parquet ✅
Feather ✅
Arrow ✅
Index Databases
Indexes dramatically improve SQL performance.
Handle Missing Values Efficiently
Don’t simply delete rows.
Instead
Mean
Median
Interpolation
Domain-specific logic
🚀 Best Practices
✅ Understand business goals
✅ Document every step
✅ Keep reproducible notebooks
✅ Automate repetitive reports
✅ Validate data
✅ Visualize frequently
✅ Test assumptions
✅ Monitor data quality
✅ Version datasets
✅ Secure sensitive data
❌ Common Mistakes
🚫 Ignoring missing values
🚫 Believing every correlation
🚫 Overfitting models
🚫 Using too many charts
🚫 Poor documentation
🚫 Dirty datasets
🚫 Wrong chart selection
🚫 No business understanding
🚫 Ignoring outliers
🚫 Not validating results
💼 Real-World Example
Suppose a food delivery company wants faster deliveries.
Collected Data
- Driver location
- Delivery time
- Traffic
- Restaurant preparation time
- Weather
Analysis reveals
70% delays occur due to restaurant preparation.
Instead of hiring more drivers,
they improve restaurant workflows.
Delivery time drops by 22%.
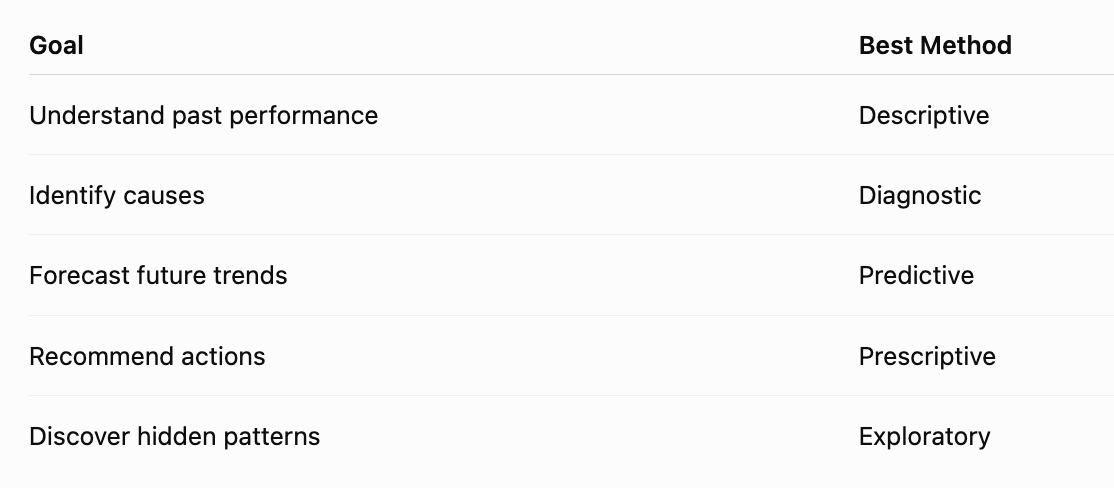
📊 Choosing the Right Analysis Method
🔥 Advanced Techniques
✅ Time Series Analysis
✅ A/B Testing
✅ Cohort Analysis
✅ Cluster Analysis
✅ Survival Analysis
✅ NLP (Text Analysis)
✅ Sentiment Analysis
✅ Network Analysis
✅ Geospatial Analysis
🔒 Data Ethics & Governance
Responsible data analysis goes beyond technical skills. Always:
- 🔐 Protect sensitive and personal information.
- 📜 Follow privacy regulations (such as GDPR or local laws where applicable).
- ⚖️ Be transparent about assumptions and limitations.
- 🤝 Reduce bias by using representative data.
- 🧾 Maintain data lineage and audit trails.
Trustworthy insights come from trustworthy data practices.
📋 Data Analysis Checklist ✅
Before starting:
- 🎯 Define the business objective.
- 📂 Identify reliable data sources.
- 🛡️ Verify data permissions and privacy requirements.
During analysis:
- 🧹 Clean and validate the data.
- 📊 Explore patterns and detect outliers.
- 🧪 Test assumptions with appropriate statistical methods.
- 📈 Visualize findings clearly.
- 📝 Document every transformation.
Before presenting:
- ✅ Validate results with stakeholders or domain experts.
- 📢 Highlight actionable insights instead of only numbers.
- 🔄 Make the workflow reproducible.
- 📦 Archive datasets and analysis scripts.
🌟 Final Thoughts
Data analysis isn’t just about creating charts — it’s about asking the right questions, uncovering meaningful insights, and driving smarter decisions.
The most effective analysts combine technical expertise, business understanding, critical thinking, and clear communication. Whether you’re analyzing sales, healthcare, finance, marketing, or scientific data, following a structured process and using the right tools will help you transform raw information into measurable impact.
“Data is a precious thing and will last longer than the systems themselves.” — Tim Berners-Lee
Master the fundamentals, automate repetitive tasks, embrace modern tools, and always let data guide your decisions. 📊🚀


Comments
Post a Comment